
Mission Success: SQL in Python in Colab
After my project to export RocketLaunch.Live's data via API, I was itching to really get into the datasets and knock out a couple of joins to merge my files into a clean dataset for further downstream analysis. But I didn't want to spin up a local DB server, so I used Colab to import the output CSV files from my Google Drive into a few DataFrames:
#Step 1: Set up environment

# Mount Google Drive to Colab
#Reference: https://stackoverflow.com/questions/48340341/how-to-read-csv-to-dataframe-in-google-colab
from google.colab import drive
drive.mount('/content/gdrive')

#Import libraries
import pandas as pd
import duckdb
import matplotlib.pyplot as plt
import numpy as np

path='/content/gdrive/MyDrive/faroutdata/rocketlaunch-live-api/'

companies=pd.read_csv(path+'companies.csv')
launches=pd.read_csv(path+'launches.csv')
locations=pd.read_csv(path+'locations.csv')
missions=pd.read_csv(path+'missions.csv')
pads=pd.read_csv(path+'pads.csv')
tags=pd.read_csv(path+'tags.csv')
vehicles=pd.read_csv(path+'vehicles.csv')
I could then run standard SQL queries over these DataFrames to establish logical relationships between the launch, company, vehicle and pad entities to get a single combined DataFrame and write to a new CSV file:
df = duckdb.query(
    "SELECT c.name as co_name, c.country_name as co_country_name, c.country_code as co_country_code, l.t0 as launch_planned_dt, l.date_str as launch_actual_dt, right(l.date_str ,4) as launch_actual_year, l.suborbital,l.result, l.missions_0_id as mission_id, l.missions_0_name as mission_name, v.id as vehicle_id, v.name as vehicle_name, v.company_name as vehicle_co_name, l.pad_name, l.pad_location_name, l.pad_location_state, l.pad_location_statename, l.pad_location_country, p.location_country_code as pad_location_country_code, p.location_latitude as pad_location_latitude, p.location_longitude as pad_location_longitude FROM launches as l LEFT JOIN companies as c on l.provider_id = c.id LEFT JOIN vehicles as v on l.vehicle_id = v.id LEFT JOIN pads as p on l.pad_id = p.id"
).to_df()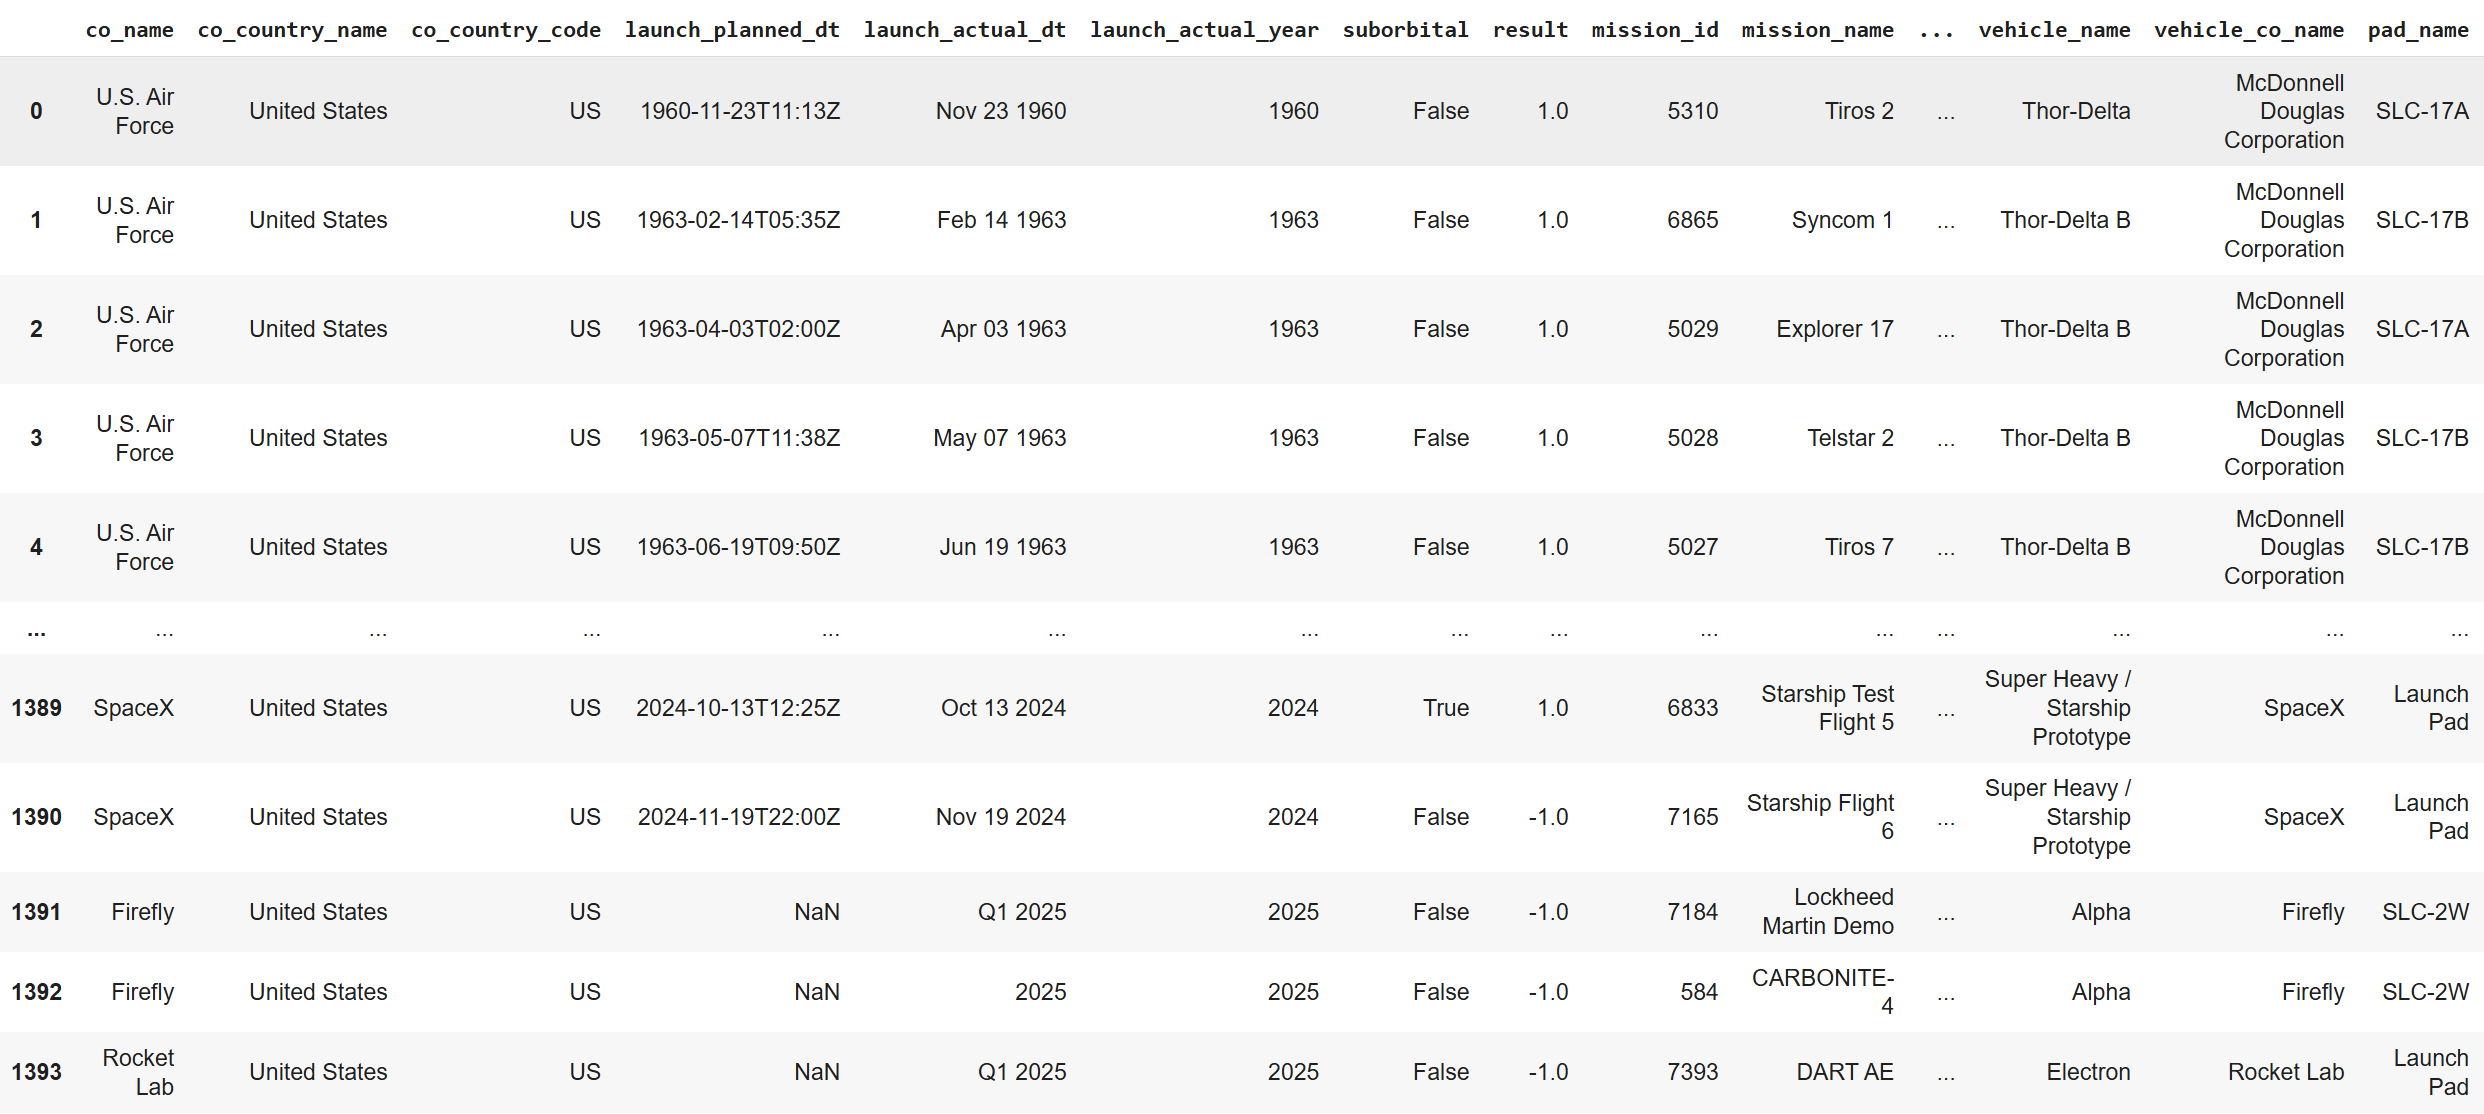
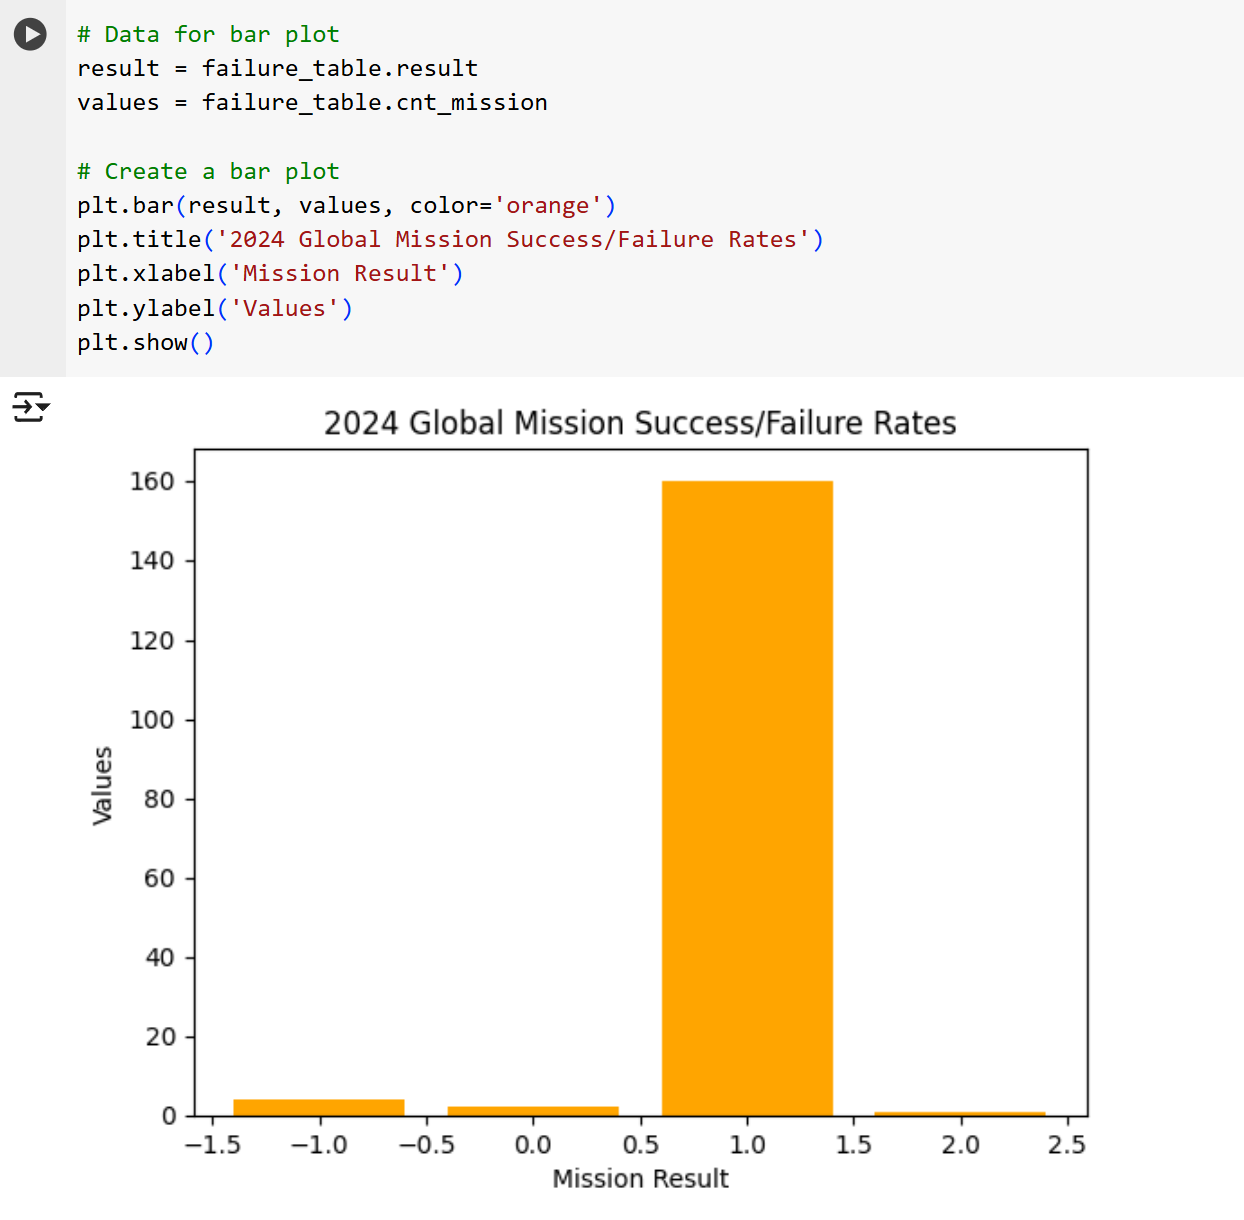
It's not the most elegant approach, but perfectly suited to quick and dirty wrangling of multiple CSV files for downstream analysis. I was able to use my new dataset to visualize mission success rates for 2024:
Colab is great for parsing and plotting data, but Tableau is better for interactive visualizations, so I connected Tableau Public to my Google drive and created a new extract using the merged CSV file. Launch Dates from the API are coded as MMM DD YYYY (e.g. Jan 01 2025), so I had to use a Calculated Field to parse API values into actual Tableau Date time-series values:
MAKEDATE(int(right([Launch Actual Dt],4)), [mmm_str_to_int], int(mid([Launch Actual Dt],5,2)))Finally, I created a quick dashboard that allows you to compare Mission Success/Failure Counts and Rates across different launch vehicles and time periods:

Now that we can drill down into the API data, we can run a few data quality checks to ensure the reliability of our dashboard:
- Blue Origin's New Glenn had 1 successful launch on 16th January 2025, this is captured in our Tableau dashboard
- SpaceX's Starship prototype had 1 planned failure on 16th January 2025, this is also captured in our Tableau dashboard
- India launched 5 rockets in 2024, and all 5 missions are reflected both in our dashboard and in the ISRO's mission log
Areas for improvement are to automate the Colab notebook using colabctl to write the API data to Google Sheets, and set up a Tableau extract refresh schedule (which isn't available on Tableau Public) for end-to-end automation.
Stack: Google Colab, Python, Tableau
Code: Colab notebook